


Industrial Heat Reduction Solutions: Survey, Calculation and Selection by Investment Priority
Industrial heat reduction should not begin with buying more fans or cooling equipment. The right decision must begin with heat sources – worker exposure – product quality requirements – operating conditions – life-cycle cost, followed by selection of the most appropriate technical solution.
Main contents
- Identify heat sources and risks
- Survey parameters and reference standards
- Heat-load and airflow calculations
- Comparison of six solution groups
- Selection matrix by investor priority
- ROI and life-cycle cost
- Survey – design – acceptance process
- FAQ and survey contact
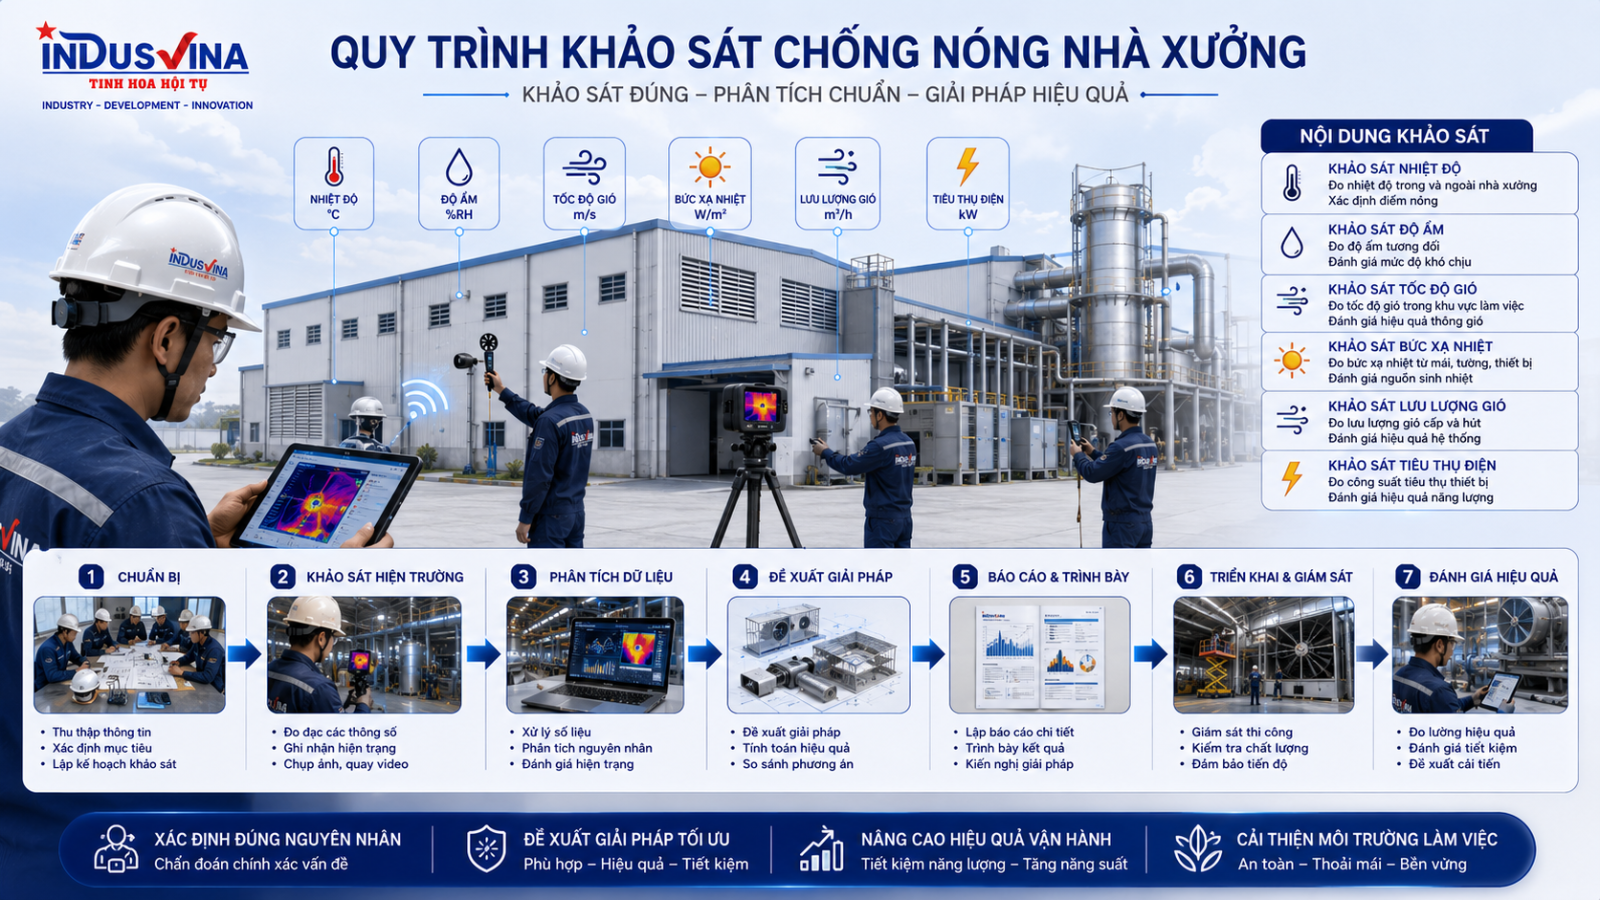
1. Why do factories become hot, and why can no single solution fit every facility?
Factory heat is usually the combined result of solar radiation through the roof and walls, heat from machinery – furnaces – motors – air compressors, heat generated by people, hot outdoor air, high humidity, accumulated hot air at high level, and layouts that obstruct airflow.
Heat through the building envelope
Metal roofing absorbs solar radiation and transfers heat into the occupied space. This is often a major load in low buildings with wide roofs and little insulation.
Process heat
Furnaces, presses, compressors, electrical panels and large motors create concentrated hot spots. General ventilation cannot replace source extraction.
Operational heat problems
Incorrect supply and exhaust locations, stored goods blocking air paths, fans merely recirculating hot air, or unbalanced make-up and exhaust airflow.
2. Mandatory survey parameters
| Measurement group | Parameters | Purpose | Suggested instruments |
|---|---|---|---|
| Thermal environment | Dry-bulb temperature, globe temperature, WBGT, relative humidity | Assess convective and radiant heat and the risk of heat stress | WBGT meter, thermo-hygrometer, globe thermometer |
| Airflow | Air velocity, direction, pressure difference and flow rate | Identify dead zones, short-circuit airflow and supply–exhaust imbalance | Anemometer, balometer, differential pressure meter |
| Building envelope | Roof/wall surface temperature, thermal transmittance and exposed area | Calculate heat transfer through the building envelope | Thermal camera, infrared thermometer, as-built drawings |
| Process sources | Machine power, utilisation factor, rejected heat and operating time | Separate process heat from environmental heat loads | Power analyser, data logger, equipment records |
| People | Work intensity, PPE, work/rest duration | Assess occupational heat exposure by task group | Work observation, interviews and metabolic-rate classification tables |
3. Reference parameters and standards
The values below are intended for survey and preliminary design guidance. Project documents must be checked against the currently applicable standards and regulations, process conditions, investor requirements and WBGT measurements at the workstation.
| Subject | Reference | Value/criterion for preliminary design | Important note |
|---|---|---|---|
| Workplace microclimate | QCVN 26:2016/BYT | Temperature, humidity and air movement are assessed according to light, moderate and heavy work; relative humidity is commonly controlled within approximately 40–80% | Use the correct table for season, work category and actual conditions, and verify that the legal document remains in force |
| Occupational heat stress | NIOSH/ACGIH – WBGT | Use WBGT together with metabolic workload, heat acclimatisation and work/rest ratio | Do not use dry-bulb temperature alone to conclude that conditions are safe |
| Thermal comfort | ASHRAE Standard 55 | Evaluate air temperature, mean radiant temperature, humidity, air speed, activity level and clothing as an integrated set | More suitable for regularly occupied areas; it does not replace occupational safety exposure limits |
| Ventilation | ASHRAE 62.1 and process requirements | Determine outdoor airflow by occupancy, floor area, contaminants and production process | ACH is only a preliminary indicator; airflow distribution and heat load must also be checked |
| Occupational health and safety | ISO 45001 / project HSE requirements | Hazard identification, risk control, monitoring, training and emergency response | Engineering controls must be combined with work/rest procedures and hydration |
| Energy management | ISO 50001 | Establish an energy baseline, KPIs, measurement and continual improvement | Meter electricity separately for fans, pumps, chillers and evaporative-cooling systems |

4. Preliminary calculations before equipment selection
4.1. Building volume and air-change airflow
QACH = V × N
Where: V is the effective volume (m³); N is the air-change rate per hour (h⁻¹); Q is airflow (m³/h).
Example: a factory measuring 30 × 20 × 7 m has V = 4,200 m³. If 20 ACH is selected for preliminary sizing, Q = 84,000 m³/h. This is not yet the final airflow because the heat load, pressure loss, make-up air and occupied-zone distribution must still be checked.
4.2. Airflow based on sensible heat load
Q: m³/h; Φ: sensible heat to be removed (kW); ΔT: allowable temperature difference between indoor and supply/exhaust air (°C). This factor is for preliminary calculation under ordinary air conditions.
For a total sensible heat load of 180 kW and an allowable ΔT of 6°C: Q ≈ 90,000 m³/h. When the ACH and heat-load results differ, use the more demanding case and then verify airflow distribution by detailed calculation or simulation.
4.3. Heat gain through the roof
U: W/m²K; A: m²; equivalent ΔT includes the effect of solar radiation.
4.4. Number of fans and electrical power
P ≈ Q × Δp / (3,600 × η)
Use airflow at the actual operating point, not the “free-air” catalogue value.
5. Six solution groups and their expected performance
1. Roof insulation and solar reflectance
Reduces heat entering the building and is suitable when the roof is the dominant source. It does not remove process heat or accumulated hot air.
Operating electricity: very low2. Natural ventilation
Uses pressure differences and stack effect. Performance depends on outdoor wind, opening area and the hot-air escape path.
Low CAPEX – weather dependent3. Exhaust fans with make-up air
Actively removes hot air. Adequate make-up openings are essential; otherwise fan airflow falls and dust is drawn through uncontrolled gaps.
Moderate – stable performance4. Local heat extraction
Hoods, ductwork and fans are installed close to the heat source. This is often more effective than increasing whole-factory ventilation.
Priority for furnaces and hot machines5. Evaporative cooling
Can significantly reduce supply-air temperature when outdoor air is not close to saturation. Performance decreases when outdoor humidity is high.
Moderate OPEX – increases humidity6. Industrial HVAC
Provides close control of temperature, humidity and cleanliness. It suits high-quality processes but requires higher CAPEX and energy use.
Best control – highest cost
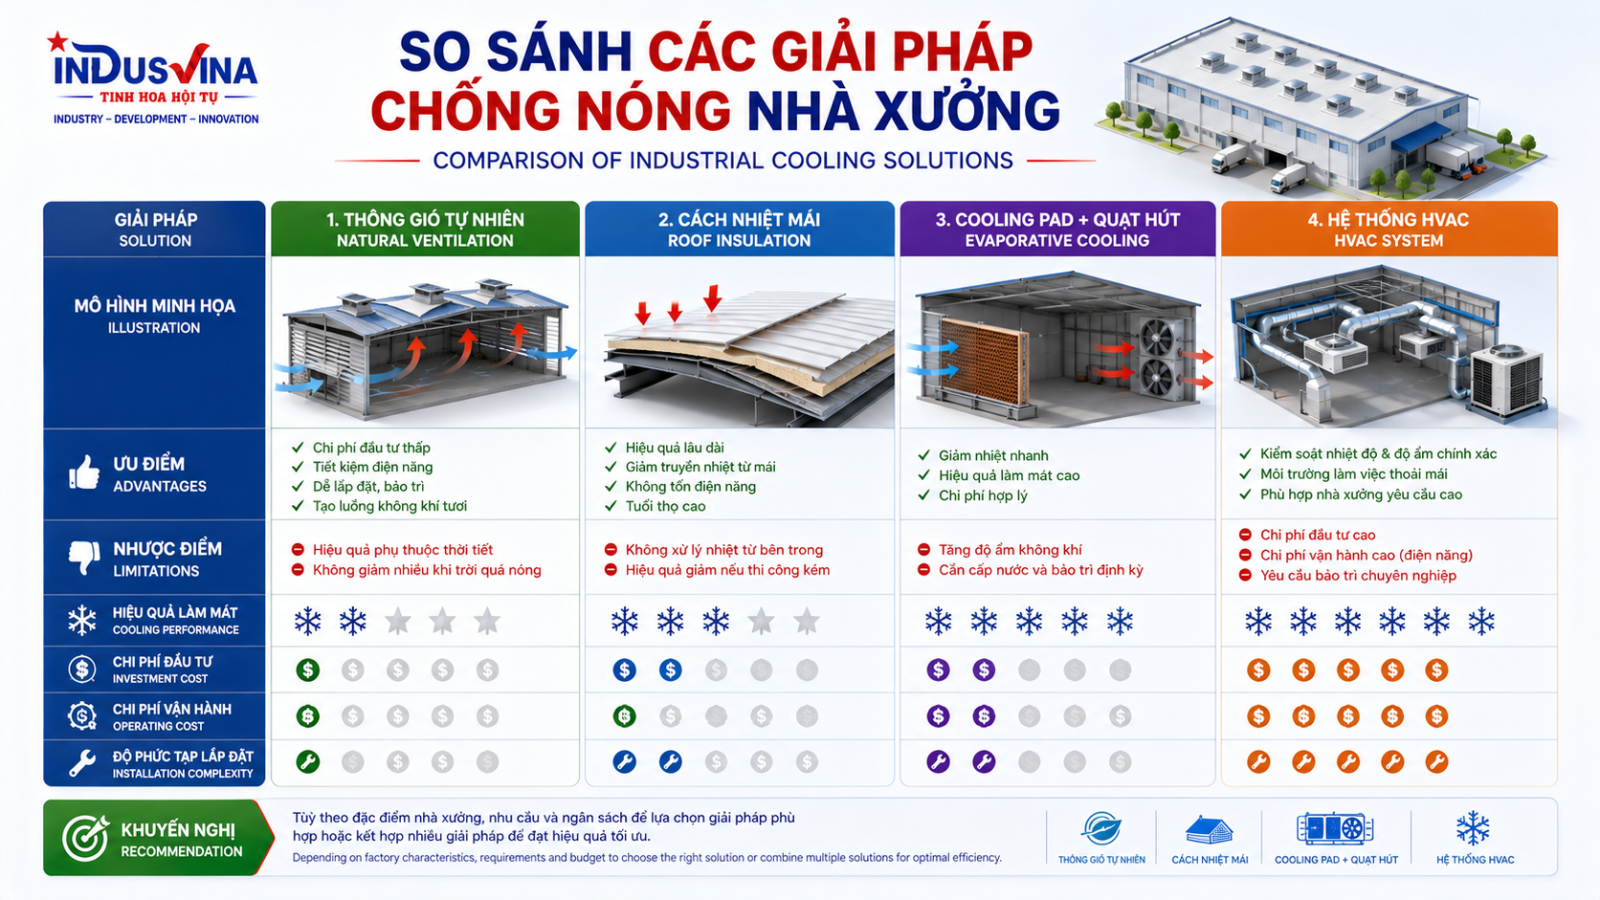
6. Quantitative comparison of solutions
| Solution | Ability to reduce load/perceived heat | Humidity control | Energy use | Maintenance | Best application |
|---|---|---|---|---|---|
| Roof insulation | Good for roof load | No | Almost zero | Low | Metal roofs with high solar gain and long operating hours |
| Natural ventilation | Low–moderate | No | Zero | Very low | Open factories with limited process heat |
| Supply/exhaust fans | Moderate | No | Low–moderate | Low | Accumulated hot air requiring active air replacement |
| Local extraction | Very good at source | No | Low–moderate | Moderate | Furnaces, presses, compressors and clearly defined hot spots |
| Cooling pad | Good when outdoor air is dry | Raises humidity | Moderate | Moderate | General manufacturing where additional humidity is acceptable |
| HVAC | Very high and stable | Controllable | High | High | Electronics, pharmaceuticals, food, cleanrooms and premium-brand production |
Actual performance depends on climate, heat load, building tightness, operating hours and air-distribution design. Do not use this table to guarantee an indoor temperature before a site survey.
7. Selection according to the investor’s priorities
There is no “absolute best option”. The optimum option is the one that fulfils the priority objective with an acceptable level of risk and life-cycle cost.
| Top priority | Decision criteria | Preferred solutions | What must not be traded off |
|---|---|---|---|
| Occupational safety | WBGT, time above limits, cool rest areas, hydration and alarms | Heat blocking + local extraction + controlled ventilation + work/rest management; HVAC where mandatory | Never trade safety for lower initial cost |
| Brand and product quality | Stable production conditions, product quality and customer audits | HVAC/humidity control, BMS, N+1 redundancy and continuous monitoring | Do not use evaporative cooling where humidity can damage the product |
| Factory reputation | Working environment, compliance and image with customers and employees | Integrated, visually orderly, low-noise solutions with transparent measurement | Avoid temporary measures that create leaks, dust, noise or safety hazards |
| Profitability | NPV, payback, energy use, maintenance and productivity | Prioritise passive measures and source control; extend HVAC only to high-value areas | Do not focus only on CAPEX while ignoring OPEX and downtime |
Weighted scoring matrix
Example investor weighting: Safety 40% – Quality/Brand 25% – Profitability 25% – Schedule 10%. Score each option from 1 to 5 and select the highest total after eliminating any option that fails a mandatory condition.
Safety 40%
WBGT, PPE, rest areas and fire/explosion risk.
Brand 25%
Quality, audits and working environment.
Profitability 25%
OPEX, productivity, payback and downtime.
Schedule 10%
Ability to install without shutting down the factory.
8. Life-cycle cost, ROI and performance verification
Life-cycle cost
- Initial investment
- Electricity and water
- Maintenance and consumables
- Equipment replacement
- Downtime and quality losses
- Retrofit cost if the wrong solution is selected
Value delivered
- Lower heat stress and accident risk
- More stable product quality
- Higher productivity and employee retention
- Less equipment overheating
- Lower energy use than an oversized system
- Higher credibility during customer audits
Annual net benefit = energy savings + reduced production loss + reduced downtime + productivity benefit − additional operating and maintenance cost.

9. INDUSVINA implementation process
Step 1 – Site survey
Survey during the hottest period and identify occupied areas, heat sources, airflow paths and construction constraints.
Step 2 – Measurement
Log temperature, WBGT, humidity, air speed, surface temperature and electrical consumption over time.
Step 3 – Analysis
Prepare a heat balance, distinguish primary and secondary causes, and define design constraints.
Step 4 – Design
Calculate airflow, pressure loss, equipment quantity, air paths, noise, electricity use and maintainability.
Step 5 – Installation
Prepare shop drawings, method statements, QA/QC and HSE plans, and coordinate the work without disrupting production.
Step 6 – Verification
Measure before and after under comparable conditions, accept against defined KPIs and establish a maintenance and improvement plan.
10. Common mistakes
- Adding exhaust fans without make-up air: actual airflow falls and hot air continues to recirculate.
- Using cooling pads in humidity-sensitive industries: temperature may fall while product defects and corrosion increase.
- Measuring only dry-bulb temperature: radiant heat, humidity and workload are overlooked.
- Treating ACH as the final answer: total airflow may be adequate while the occupied zone still receives no useful air movement.
- Selecting equipment by catalogue airflow: pressure loss and the real operating point are not considered.
- Failing to verify after installation: actual performance and the cause of any shortfall remain unknown.

11. Conclusion
An effective industrial heat-reduction solution is not the system with the largest capacity. It is a coordinated set of measures that addresses the correct heat source, protects the correct zone and matches the investor’s true objective. When occupational safety is the top priority, every option must satisfy WBGT and exposure-control requirements. When brand and product quality are central, control of temperature – humidity – cleanliness must take precedence over the lowest initial cost. When profitability is the priority, the full life-cycle cost must be optimised rather than comparing equipment prices alone.
FAQ – Frequently asked questions
1. Where should an industrial heat-reduction project begin?
2. What temperature is considered too hot?
3. Are cooling pads suitable for every factory?
4. When should HVAC be used?
5. Is a larger exhaust fan always better?
6. How many degrees of cooling can be guaranteed?
7. How can performance be demonstrated after investment?
8. Which solution normally has the best ROI?
Connect with INDUSVINA
INDUSVINA is ready to survey, measure, calculate and propose an industrial heat-reduction solution suited to actual factory conditions – from insulation, ventilation and local extraction to cooling pads, HVAC and energy management.
0979 823 639
info@indusvina.com
www.indusvina.com
Ho Chi Minh City, Vietnam


