


Measurement Inspection – The Key to Early Failure Detection in Industrial Plants and Buildings
Equipment rarely fails without warning. Temperature, vibration, current, pressure, noise, insulation condition and operating performance usually change before a failure becomes a loss.
Measurement Inspection is not measurement for its own sake
Technical Value
- Convert subjective observations into comparable data.
- Detect deviation before operating limits are exceeded.
- Differentiate symptoms, causes and priority levels.
Management Value
- Prioritize resources by risk level.
- Support maintenance decisions with documented evidence.
- Protect safety, reputation, output and profitability.
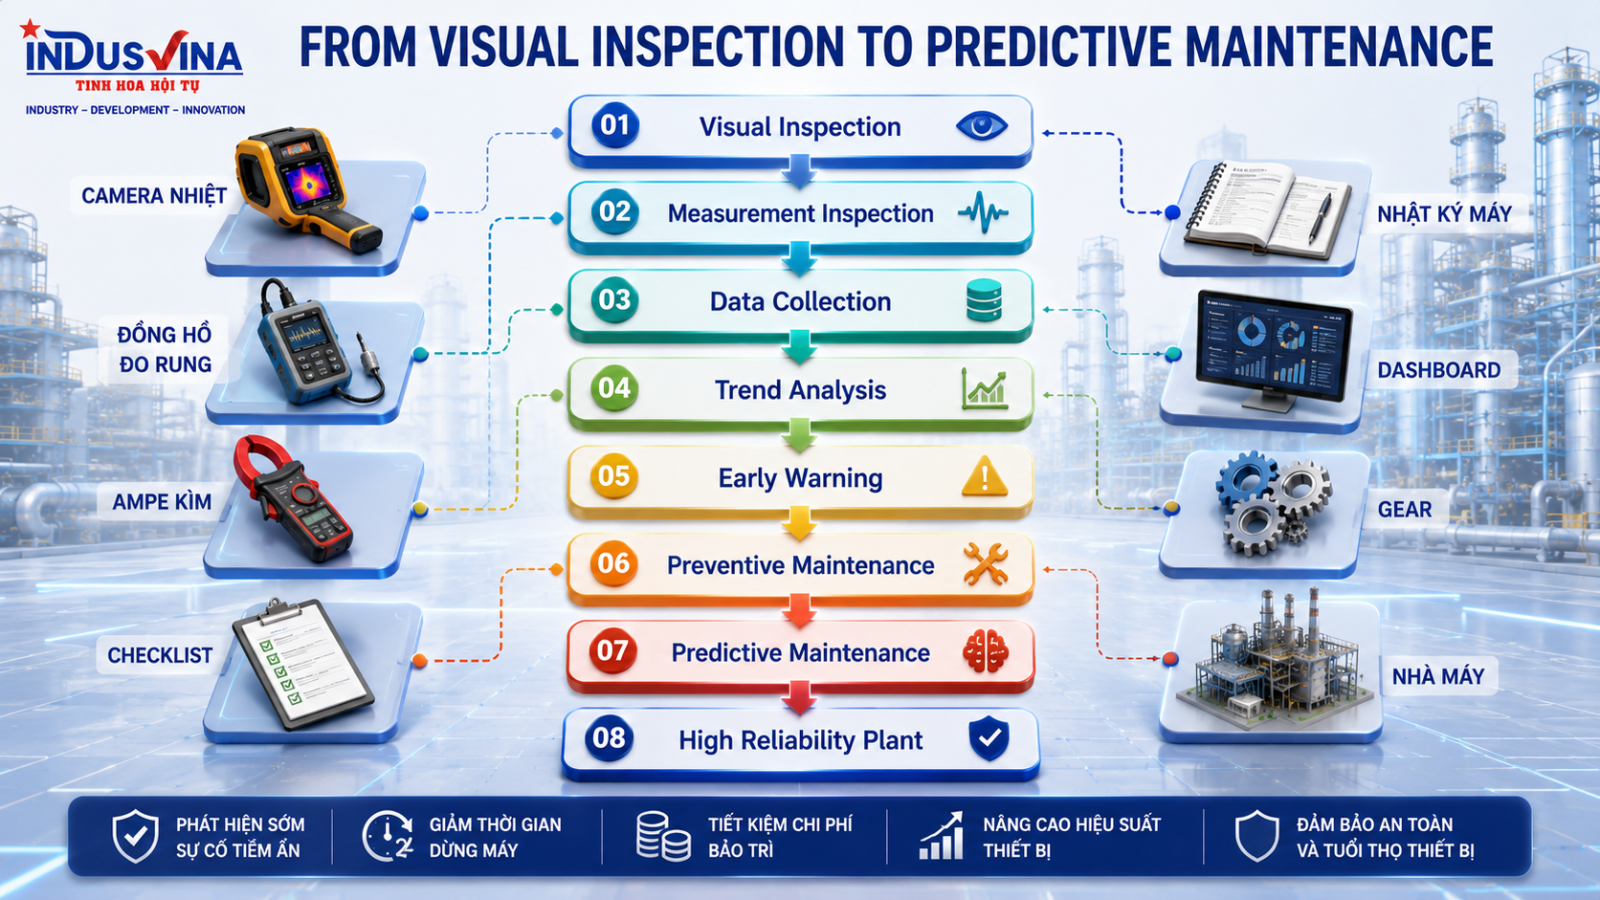
Four maturity layers of a maintenance system
1. Visual
Observe, listen, smell and check external conditions to screen for abnormalities.
2. Measurement
Use measuring instruments to generate data with units, time, location and load condition.
3. Preventive / CBM
Maintain assets by schedule and actual condition.
4. Predictive
Analyze trends, model deterioration and forecast when degradation may occur.
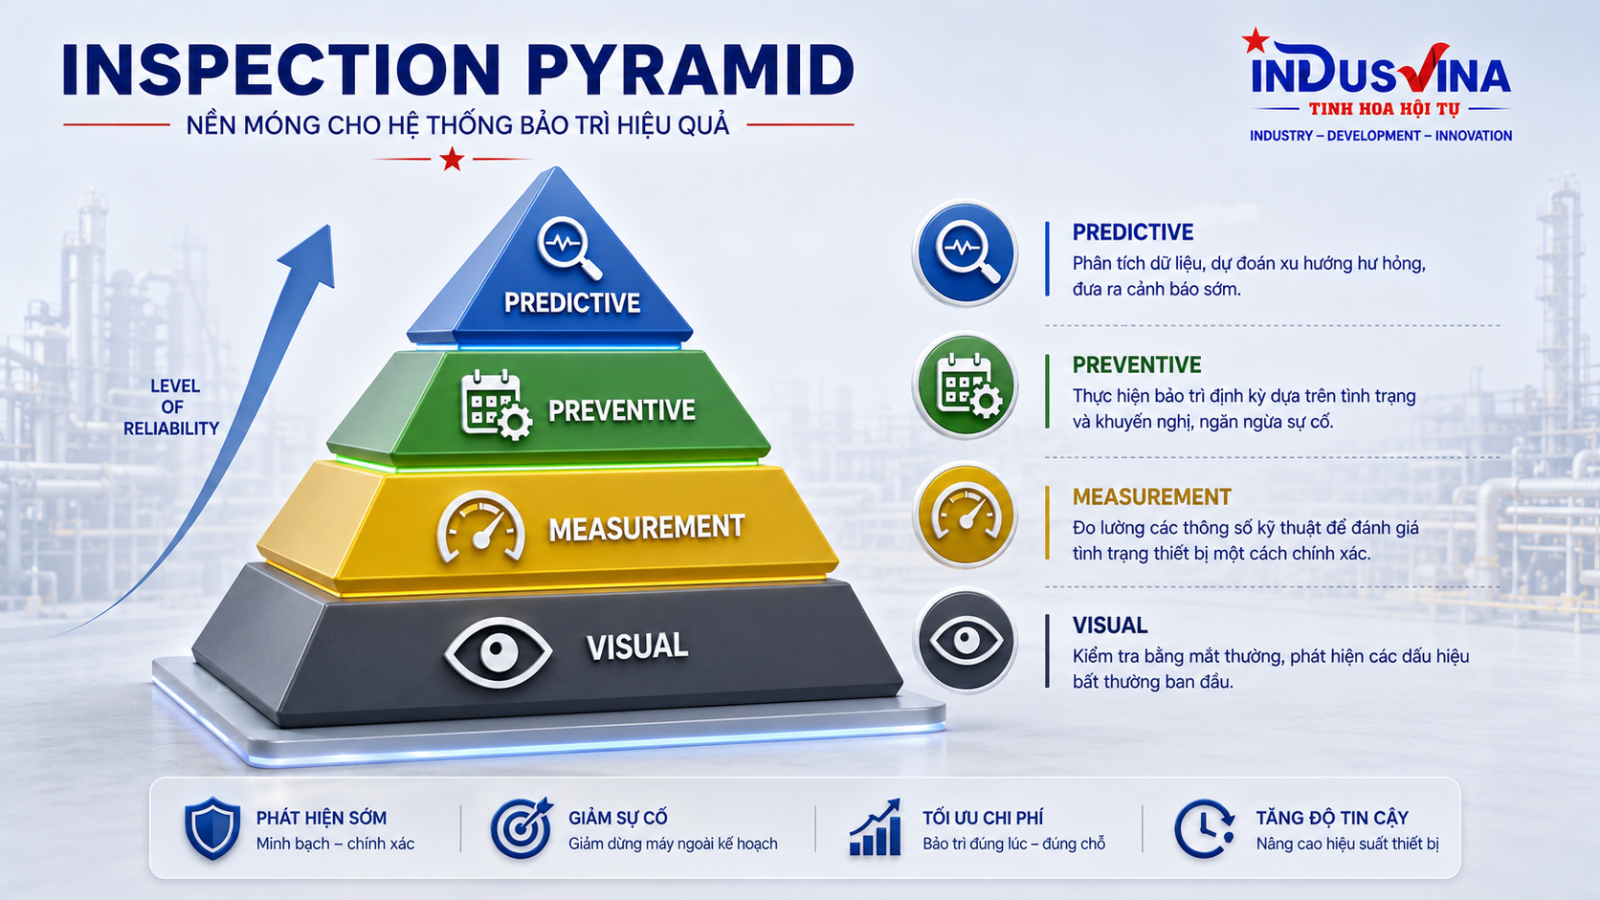
Visual Inspection and Measurement Inspection
| Criterion | Visual Inspection | Measurement Inspection | Application conclusion |
|---|---|---|---|
| Nature | Qualitative, rapid screening | Quantitative, instrument-based | Combine them; neither replaces the other |
| Advantages | Fast, low cost and suitable for frequent use | Evidence-based, comparable and trendable | Visual for broad coverage; Measurement for critical points |
| Limitations | Depends on experience and observation skill | Depends on method, calibration, measurement point and test condition | Requires procedures and competent personnel |
| Result | “It appears hot, vibrating or weak” | “How much temperature, current, vibration or pressure has changed” | Good data requires timestamps and a baseline |
| Role | Detect signs | Confirm severity and trend | Together they support maintenance decisions |
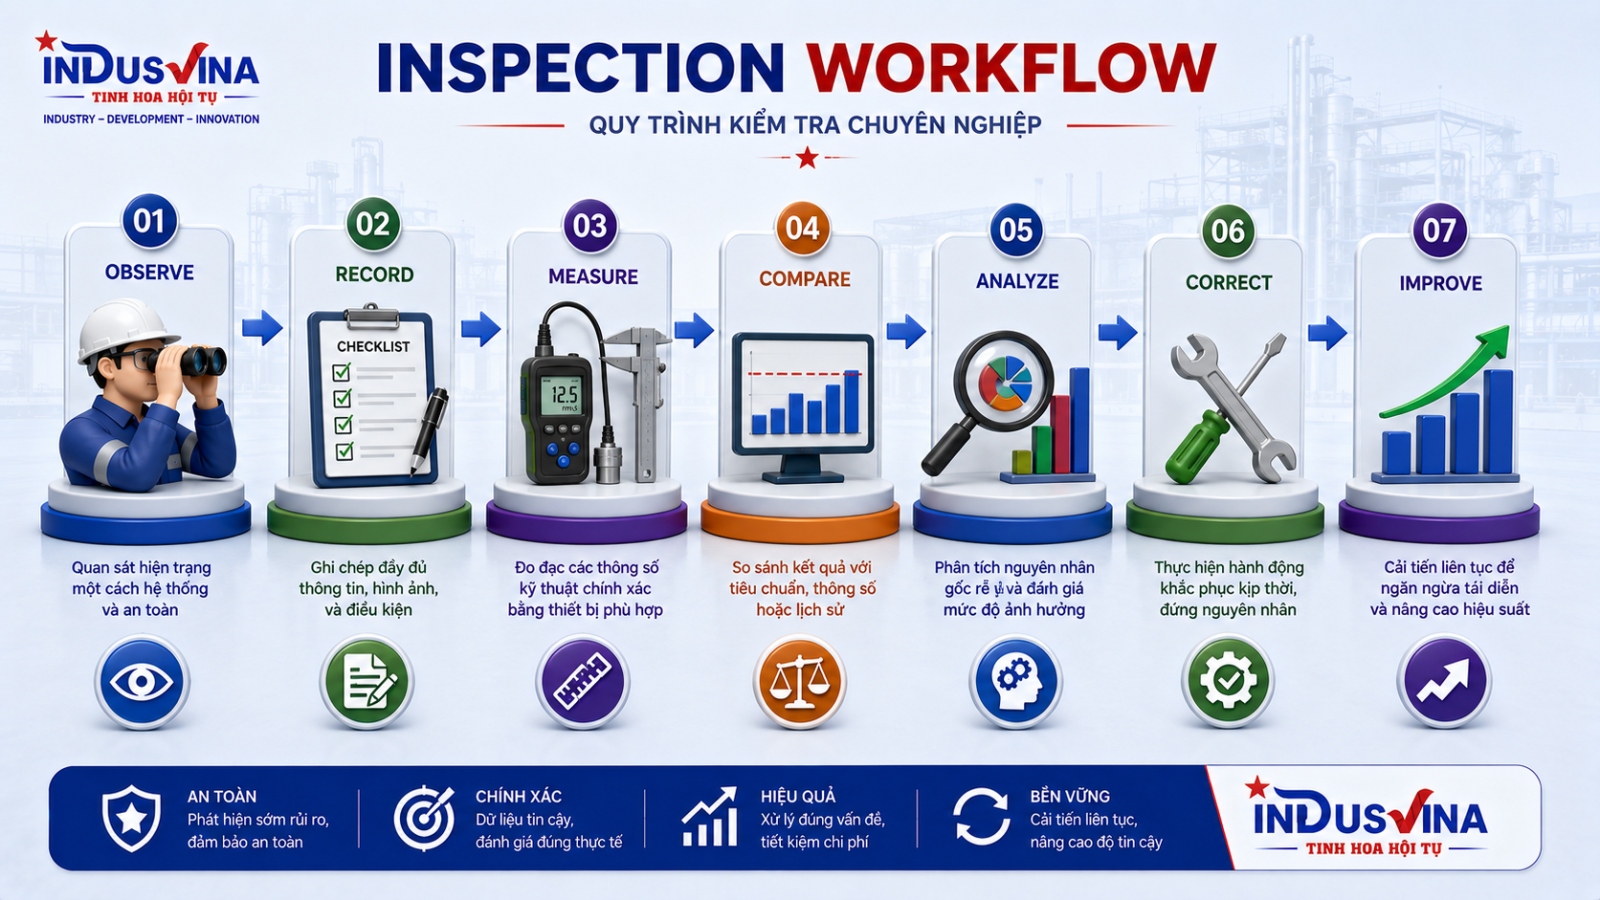
Inspection Workflow: from signs to closed-loop action
Observe
Identify abnormal signs through the senses, indicators, alarm history or operator feedback.
Record
Record the correct asset ID, location, time, load, environment and inspector.
Measure
Use suitable, calibrated instruments; measure at the correct point and repeat under comparable conditions.
Compare
Compare with baseline, OEM requirements, applicable standards, similar machines and previous readings.
Analyze
Assess possible causes, severity, deterioration rate and consequences.
Correct
Contain, temporarily correct or permanently repair in accordance with risk approval.
Improve
Update checklists, alarm thresholds, frequency, RCA records and operating lessons.
What should be measured, with which instrument, and for what decision?
| Parameter | Instrument | Asset / System | Indicators to monitor | Typical decision |
|---|---|---|---|---|
| Temperature / ΔT | Thermal camera, contact thermometer | MCC, busbar, terminals, bearings, HVAC | Hot spots, load-related heating, phase deviation | Tighten connections, balance loads, clean, inspect contacts or improve cooling |
| Current / imbalance | Clamp meter, power analyzer | Motors, pumps, fans, feeders | Overload, phase imbalance, rising current over time | Check load, power supply, mechanical condition, efficiency and protection settings |
| Vibration | Vibration meter/analyzer | Motor, fan, pump, gearbox | Rising RMS, abnormal spectrum, speed-related changes | Balance, align, inspect bearings, foundation and cavitation |
| Pressure / flow | Pressure gauge, flowmeter, data logger | HVAC, water, compressed air, fire protection | Pressure loss, fluctuation, failure to meet duty point | Check leakage, blockage, valves, pumps, filters and balancing |
| Insulation resistance | Insulation tester | Motor, cable, panel | Decline over time, moisture/temperature effects | Dry, clean, inspect cables/windings and plan repairs |
| Power quality | Power quality analyzer | Electrical systems, VFDs, UPS | THD, sag, swell, imbalance, transients | Harmonic filtering, phase balancing, protection and supply adjustment |

Reference table: apply each standard within its scope; do not use one threshold for every asset
| Topic | Standard / Reference | Correct application | Important note |
|---|---|---|---|
| Condition monitoring program | ISO 17359 – General guidelines | Define assets, criticality, measurement techniques, baseline, alarms and response process | Do not merely buy instruments; build the full data and accountability system |
| Machine vibration evaluation | ISO 20816 series | Select the correct part by machine type, power, speed, bearing support and installation condition; evaluate by Zones A–D or corresponding criteria | There is no single mm/s limit for every motor, pump and fan |
| Vibration analysis and diagnostics | ISO 13373 series | Standardize measurement locations, signal processing, trending and spectral diagnosis | Overall RMS is only the first step; root causes often require spectrum and phase analysis |
| Machinery thermography | ISO 18434-1 | Control emissivity, angle, distance, load, environment and reference images | Absolute temperature must be interpreted with ΔT and load condition |
| Electrical equipment maintenance | NFPA 70B | Build an electrical maintenance program based on condition, criticality and inspection evidence | Comply with electrical safety and LOTO; thermography does not replace de-energized contact inspection |
| Insulation resistance of rotating machines | IEEE 43 | Correct for temperature, trend IR/PI and apply criteria for the correct winding type and rated voltage | Do not conclude from one reading; consider history, temperature, humidity and OEM requirements |
| Asset management | ISO 55001 | Link condition data to risk, value, life cycle and business objectives | Inspection priorities must reflect business consequences, not only technical condition |
Core principle: standards guide the method; the asset baseline reveals the rate of change; OEM requirements and project documents define specific operating limits.
Set thresholds using three layers: limit – trend – consequence
| Parameter | Green | Yellow | Orange | Red |
|---|---|---|---|---|
| Electrical temperature (ΔT versus similar component/same load) | Stable within baseline | Slight rise or a new deviation appears | Clear rise with a continuing trend | High or rapidly rising hot spot; urgent assessment required |
| Vibration | Acceptable zone per ISO/OEM and baseline | Exceeds internal warning level or moves into another zone | Rapid rise, abnormal spectrum or operating impact | Unacceptable zone or immediate failure risk |
| Current | Within rating and balanced | Deviation from baseline/phase balance without protection trip | Near load limit, rising temperature or clear imbalance | Overload, protection operation or fire/failure risk |
| Pressure/flow | Meets duty point | Minor decline; monitor | Performance not achieved or energy use increases | Loss of safety or production function |
| Insulation | Stable after temperature correction | Lower than historical trend | Rapid decline or failure to meet internal/OEM criteria | Risk of flashover/ground fault; stop according to safety assessment |
Optimize decisions using a multi-criteria matrix
There is no single “best solution for every project.” The optimum solution is the one that satisfies all mandatory technical requirements and achieves the highest score against the investor’s priorities.
| Criterion | Safety priority | Brand priority | Facility reputation priority | Profitability priority |
|---|---|---|---|---|
| People safety & compliance | 35% | 25% | 25% | 20% |
| Reliability / downtime | 25% | 25% | 30% | 25% |
| Data quality / predictive capability | 15% | 20% | 20% | 15% |
| CAPEX | 10% | 10% | 10% | 15% |
| OPEX and life-cycle cost | 10% | 15% | 10% | 20% |
| Scalability / integration | 5% | 5% | 5% | 5% |
Example scoring of three options
| Option | Description | Safety | Reliability | Data | CAPEX | OPEX/LCC | Suitable for |
|---|---|---|---|---|---|---|---|
| A | Visual inspection + quarterly handheld measurements | 2/5 | 2/5 | 2/5 | 5/5 | 3/5 | Low-criticality assets with redundancy |
| B | Route-based: daily visual inspection + monthly/quarterly measurements + trending | 4/5 | 4/5 | 4/5 | 3/5 | 4/5 | Most industrial plants and buildings |
| C | Online sensors + BMS/SCADA/Cloud + 24/7 alarms | 5/5 | 5/5 | 5/5 | 1/5 | 4/5 | Critical assets without redundancy and with severe consequences |
OCCUPATIONAL SAFETY
Select Option C for assets that may cause fire, explosion, electric shock, loss of fire protection or serious injury. Purchase price must never override mandatory safety requirements.
BRAND REPUTATION
Prioritize traceable data, early warning and quality records. Option B or C reduces failures that could affect customers and public reputation.
FACILITY RELIABILITY & REPUTATION
Prioritize reliability, SLA performance, redundancy and recovery time. Bottleneck assets should be continuously monitored.
PROFITABILITY
Do not select the lowest-CAPEX option; select the option with the lowest total life-cycle cost and expected loss.
Calculate risk cost before deciding the investment level
| Item | Calculation | Required data |
|---|---|---|
| Downtime | Downtime hours × contribution margin per hour | Output, contribution margin, recovery time |
| Equipment damage | Materials + labor + outsourcing + emergency logistics | Repair history, BOM, lead time |
| Safety / compliance | Direct cost + indirect cost + intolerable risk level | HSE risk register, legal requirements, insurance |
| Reputation / customer | SLA penalties + lost orders + brand recovery cost | Contracts, KPIs, complaints, on-time delivery rate |
| Energy | (Baseline kW − post-improvement kW) × operating hours × tariff | Power analyzer data, operating hours, tariff |

Do not apply the same schedule to every asset
| Asset group | Characteristics | Recommended strategy | Examples |
|---|---|---|---|
| Critical | Safety-related, core production, no redundancy, severe consequences | Online monitoring or high-frequency routes; 24/7 alarm and escalation | Main incomer, fire pump, main chiller, critical compressor |
| Essential | Significant impact but with redundancy or response time | Daily visual inspection; weekly/monthly measurements; periodic trending and review | Motor, pump, AHU, local MCC |
| General | Low consequence, easy to replace, spare available | Visual checks by shift; quarterly/PM measurements or when signs appear | Auxiliary fans, small pumps, non-essential loads |
Condition-Based Maintenance and Predictive Maintenance
Data Collection
Data must include timestamp, asset ID, unit, load, environmental conditions and the person/instrument used.
Trend & Rules
Compare baseline, rate of change, thresholds and multi-variable correlations.
AI / Predictive
Anomaly-detection or predictive models are valuable only when data is sufficiently clean, sufficiently long and validated by competent specialists.
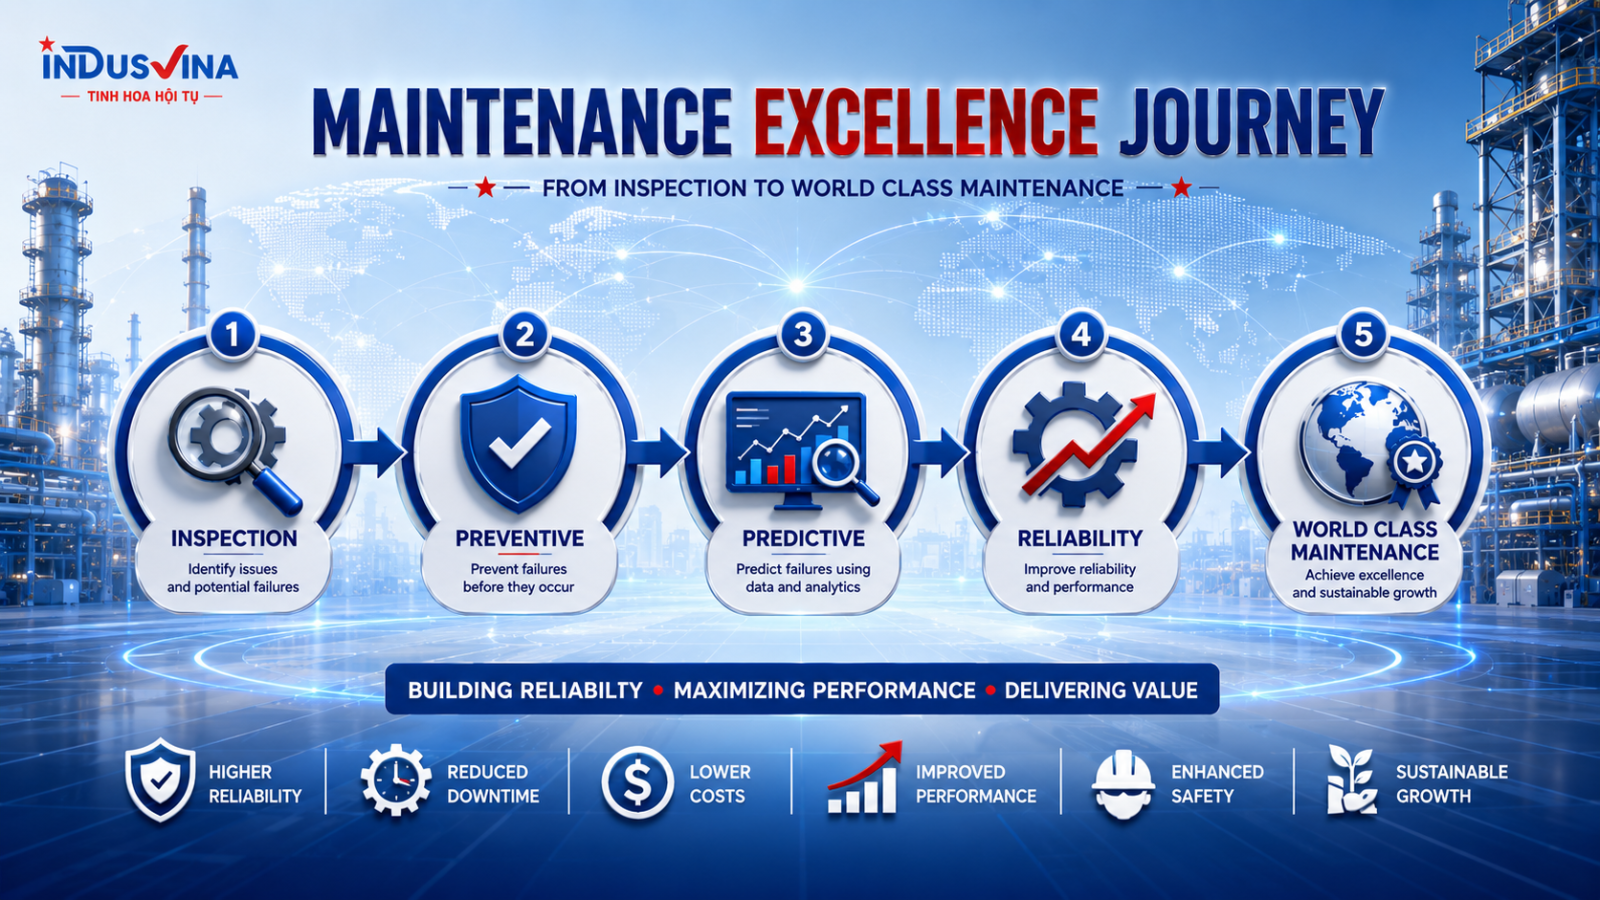
Turn the concept into an operating system
Days 0–30
- Build the asset register and criticality ranking.
- Standardize equipment IDs, checklists and measurement points.
- Verify instrument calibration.
Days 31–60
- Collect baseline data under stable load.
- Set green–yellow–orange–red thresholds.
- Train teams in visual inspection, measurement and LOTO.
Days 61–90
- Run inspection routes and analyze trends.
- Close the corrective-action loop.
- Evaluate ROI and select online-monitoring points.
Early detection does not begin with AI; it begins with disciplined measurement
Visual Inspection identifies signs. Measurement Inspection turns signs into data. Condition Monitoring turns data into trends. Preventive, Condition-Based and Predictive Maintenance turn trends into action before losses occur.
The optimum solution is not the one with the most sensors or the lowest price. It is the option that controls mandatory risks, meets the investor’s priorities and delivers the highest total life-cycle value.
Frequently Asked Questions
What is Measurement Inspection?
Can Visual Inspection replace Measurement Inspection?
When should a thermal camera be used?
How often should vibration be measured?
Can one vibration or temperature threshold be used for every machine?
When should online sensors be installed?
Can AI replace maintenance engineers?
How can INDUSVINA support your facility?
Connect with INDUSVINA
INDUSVINA supports surveys, measurement, condition analysis and maintenance-program development aligned with the risk level and investment priorities of industrial plants and buildings.
0979 823 639
info@indusvina.com
contract@indusvina.com
www.indusvina.com


